
Chart patterns pdf are important because they indicate both continuations and reversals in market trends. Traders use these patterns to make educated guesses about where the price of a security might head next, based on the pattern that the price movements are forming. This predictive ability is crucial in trading as it can inform decision-making and strategy development.
Chart Patterns Pdf
Definition of Chart Patterns PDF
A chart pattern in the context of technical analysis is a distinct formation on a stock chart that creates a trading signal, or a sign of future price movements. Chart patterns are formed by the movements of securities prices and are the foundation of technical analysis. These patterns are identified by lines and curves and are used to understand and predict trends in the market based on historical performance.
Understanding price action is essential for grasping how various chart patterns form and what they signify in the context of trading. Price action refers to the movement of a security’s price plotted over time. It is the most fundamental element in technical analysis, serving as the primary data source from which all chart patterns emerge.
How to Utilise Chart Patterns
The primary utility of chart patterns lies in their ability to provide traders with information about possible future price movements. Here’s how you can effectively utilize chart patterns:
- Identify Trend Reversals: Chart patterns can signal potential trend reversals, allowing traders to enter positions at favourable prices.
- Confirm Existing Trends: They can also serve as confirmation tools, reinforcing the trader’s belief in the current trend’s strength.
- Set Stop-Loss and Take-Profit Levels: Chart patterns help traders define their risk by setting stop-loss orders at strategic points on the chart.
- Determine Entry and Exit Points: Knowing when to enter and exit a trade is crucial for profitability. Chart patterns assist in making these decisions.
- Enhance Risk Management: Understanding the potential outcomes of a trade based on chart patterns helps traders manage their risk effectively.
Choosing the Right Timeframe
The choice of timeframe when seeking chart patterns depends on your trading style and objectives. Here are some guidelines:
- Day Traders: If you are a day trader, focus on shorter timeframes like 1-minute, 5-minute, or 15-minute charts. These timeframes provide quick insights into intraday price movements.
- Swing Traders: Swing traders often use 1-hour, 4-hour, or daily charts to identify trends that may last several days or weeks.
- Long-Term Investors: Investors with a longer time horizon typically analyse weekly or monthly charts to make informed decisions that span months or years.
table below categorises various chart patterns into their respective types:
| Bullish Reversal Patterns | Bearish Reversal Patterns | Bullish Continuation Patterns | Bearish Continuation Patterns |
|---|---|---|---|
| Head and Shoulders Bottom (Inverse Head and Shoulders) | Head and Shoulders Top | Ascending Triangle | Descending Triangle |
| Double Bottom | Double Top | Bull Flag | Bear Flag |
| Triple Bottom | Triple Top | Bull Pennant | Bear Pennant |
| Bullish Engulfing | Bearish Engulfing | Cup and Handle | Rectangles (Bearish) |
| Morning Star | Evening Star | Rectangles (Bullish) | Falling Wedge |
This table includes examples of both reversal and continuation patterns, indicating either a change in the existing trend (reversal) or a pause before the trend resumes (continuation).
Trend Continuation Chart Patterns
Trend Continuation Chart Patterns are specific formations on the chart that signal the continuation of an existing trend. These patterns suggest that, despite some consolidation or minor price movements against the trend, the overall direction of the market’s trend (upward, downward, or sideways) is likely to continue.
Bullish Continuation Chart Pattern
This pattern suggests that an asset’s price, already in an uptrend, is likely to continue rising. Common bullish continuation patterns include flags, pennants, and ascending triangles. These patterns typically form during a brief consolidation in an uptrend, after which the upward price movement resumes.
1. Bull Flag
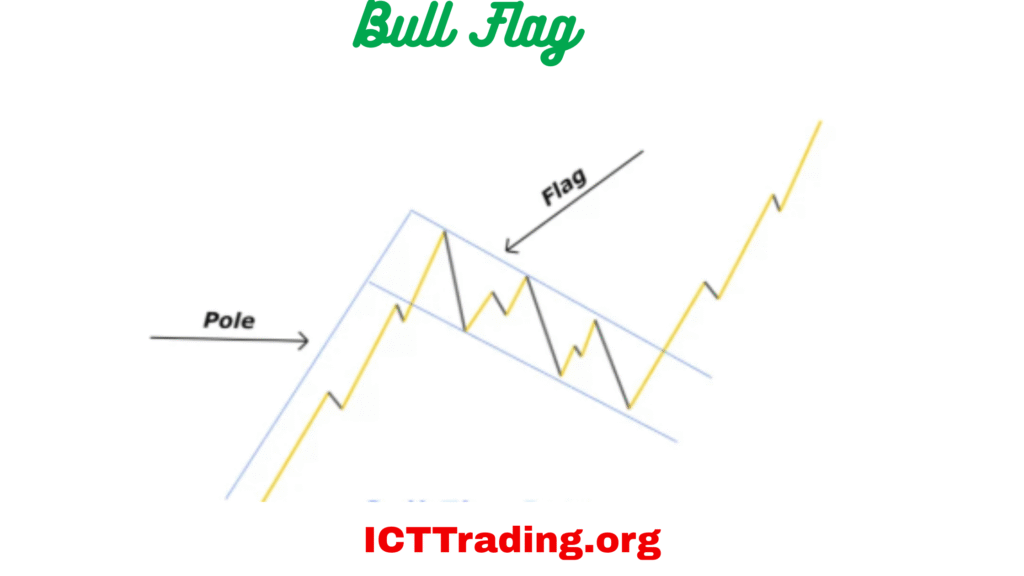
Bull Flag
- Definition: A Bull Flag is a bullish continuation pattern that appears in an uptrend. It resembles a flagpole followed by a downward-sloping rectangular consolidation, resembling a flag.
- Psychology: This pattern indicates a brief pause in the trend where bulls gather strength before pushing the price higher.
- Trading Strategy: Look for a breakout above the flag as a confirmation. Place stop-loss below the lowest point of the flag. Take profit can be set by projecting the height of the flagpole upwards from the breakout point.
2. Bull Pennant
- Definition: A Bull Pennant is a small symmetrical triangle that forms during an uptrend, following a sharp price rise.
- Psychology: It represents a pause as bulls consolidate gains and prepare for the next push upwards.
- Trading Strategy: Trade on a breakout above the pennant. Place a stop-loss below the lowest point of the pennant. The profit target is calculated by adding the height of the prior move to the breakout point.
3. Ascending Triangle
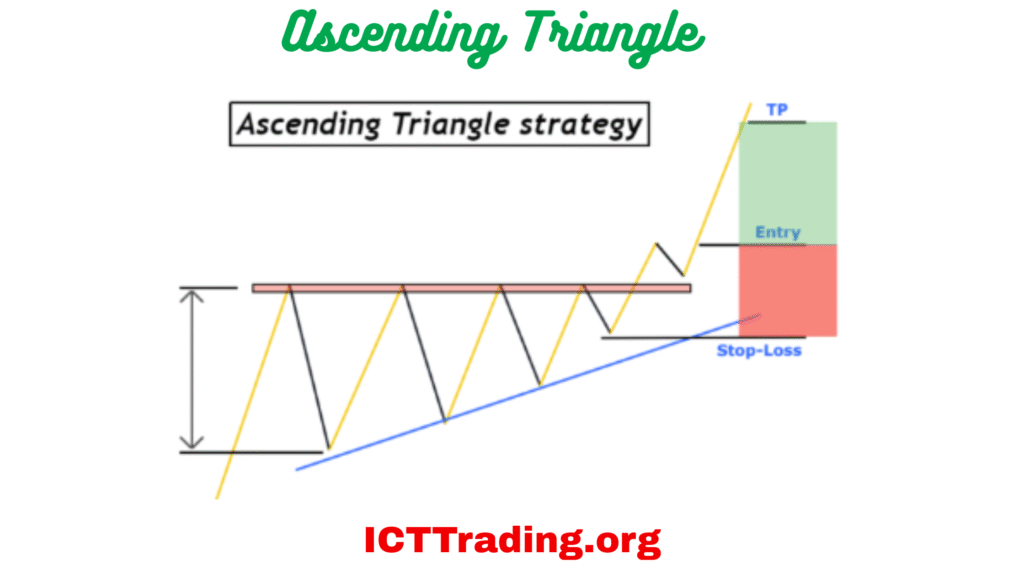
Ascending Triangle
- Definition: Characterised by a flat upper trendline and a rising lower trendline, this pattern forms during an uptrend.
- Psychology: It suggests that buyers are persistently pushing the price up against a resistance level, indicating bullish sentiment.
Bearish Continuation Chart Pattern
Conversely, this pattern indicates that an asset’s price, which is already in a downtrend, is expected to continue falling. Examples include bearish flags, pennants, and descending triangles. These patterns are observed during a pause in a downtrend, suggesting that after the consolidation, the price will likely continue to decline.
1. Bear Flag
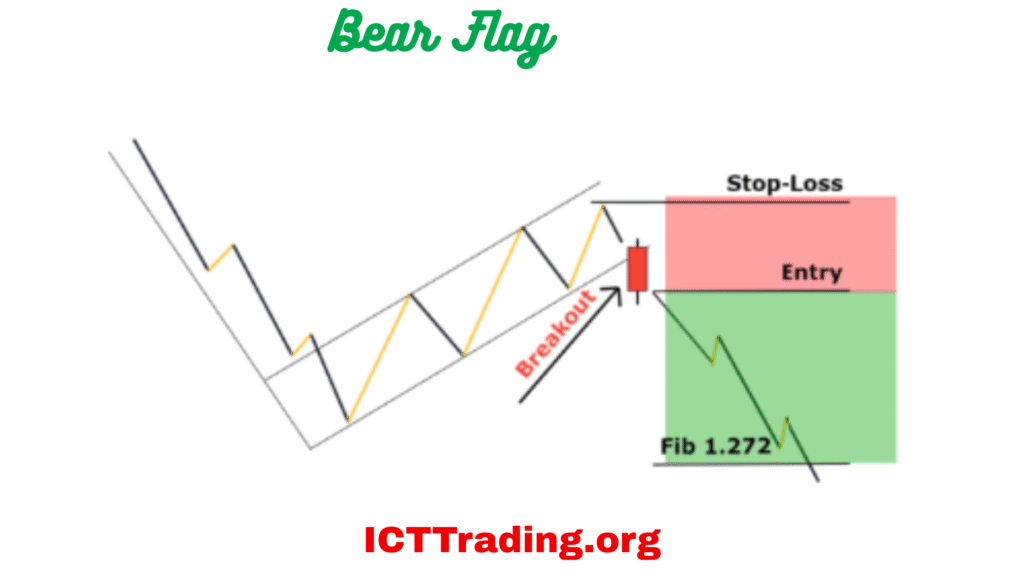
Bear Flag
- Definition: A Bear Flag is similar to the Bull Flag but inverted, forming in a downtrend. It features a sharp decline (flagpole) followed by a slight upward consolidation.
- Psychology: This pattern signifies a temporary consolidation before bears continue to drive the price lower.
- Trading Strategy: Enter a trade on a breakout below the flag. Set stop-loss above the highest point of the flag. The take-profit target can be estimated by projecting the length of the flagpole downwards from the breakout.
2. Bear Pennant
- Definition: This is the bearish counterpart of the Bull Pennant, forming during a downtrend after a sharp price drop.
- Psychology: Indicates a short pause in bearish momentum before continuing the downtrend.
- Trading Strategy: Enter on a breakout below the pennant. Set stop-loss above the pennant’s highest point. Project the height of the prior move downwards from the breakout to set a profit target.
3. Descending Triangle
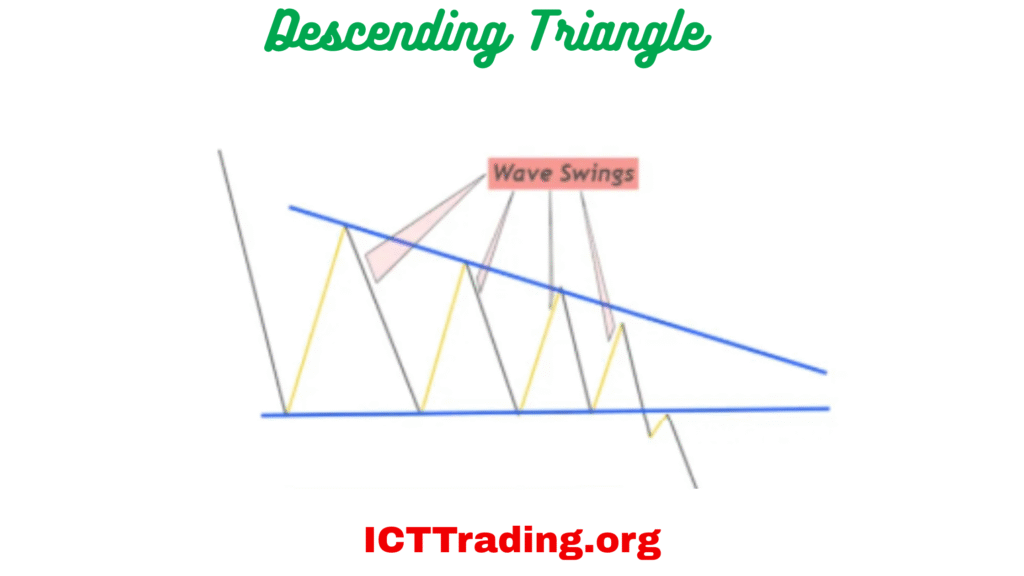
Descending Triangle
- Definition: This pattern, featuring a flat lower trendline and a descending upper trendline, forms in a downtrend.
- Psychology: Reflects sellers pushing the price down against a support level, indicating bearish sentiment.
- Trading Strategy: Enter a breakdown below the lower trendline. Stop-loss is set above the most recent swing high. The profit target can be estimated by subtracting the height of the triangle from the breakdown point.
Trend Reversal Chart Patterns
Bullish and bearish reversal chart patterns are important concepts in technical analysis, used to predict potential changes in a stock’s price direction.
Bullish Reversal Chart Patterns
These patterns signal a potential turnaround from a downtrend to an uptrend, suggesting that a stock’s price might start rising. Common bullish reversal patterns include:
Double Bottom
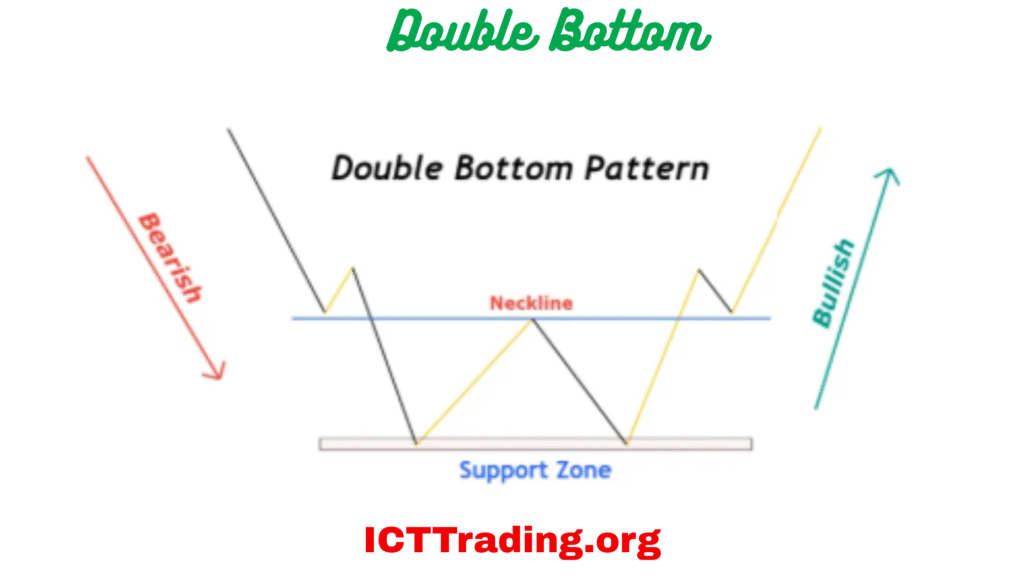
Double Bottom
- Definition: A reversal pattern where the price forms two lows at roughly the same level.
- Psychology: Suggests a strong support level, signalling a potential reversal from bearish to bullish.
- Trading Strategy: Trade on a move above the resistance level between the bottoms. Place a stop-loss below the lower of the two bottoms. The profit target is the distance between the bottom and the resistance level, added to the breakout point.
Cup and Handle
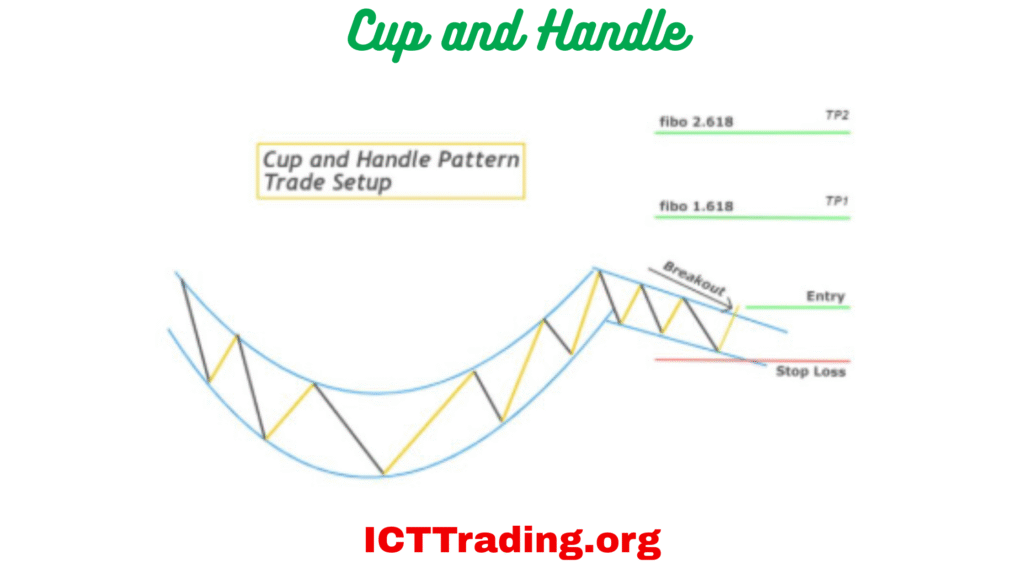
Cup and Handle
- Definition: This bullish pattern features a rounded bottom (cup) followed by a smaller consolidation (handle).
- Psychology: Indicates a gradual shift from bearish to bullish sentiment, followed by a consolidation before a bullish breakout.
- Trading Strategy: Trade on a breakout above the handle. Place a stop-loss below the lowest point of the handle. The profit target can be the height of the cup added to the breakout point.
Falling Wedge
- Definition: This bullish pattern features converging trendlines sloping downwards.
- Psychology: Suggests building bullish momentum, leading to a potential upward breakout.
- Trading Strategy: Enter on a breakout above the upper trendline. Set stop-loss below the most recent swing low within the wedge. The profit target is the height of the wedge at its widest point, added to the breakout level.
Bearish Reversal Chart Patterns
These patterns signal a potential turnaround from an uptrend to a downtrend, suggesting that a stock’s price might start falling.
Double Top
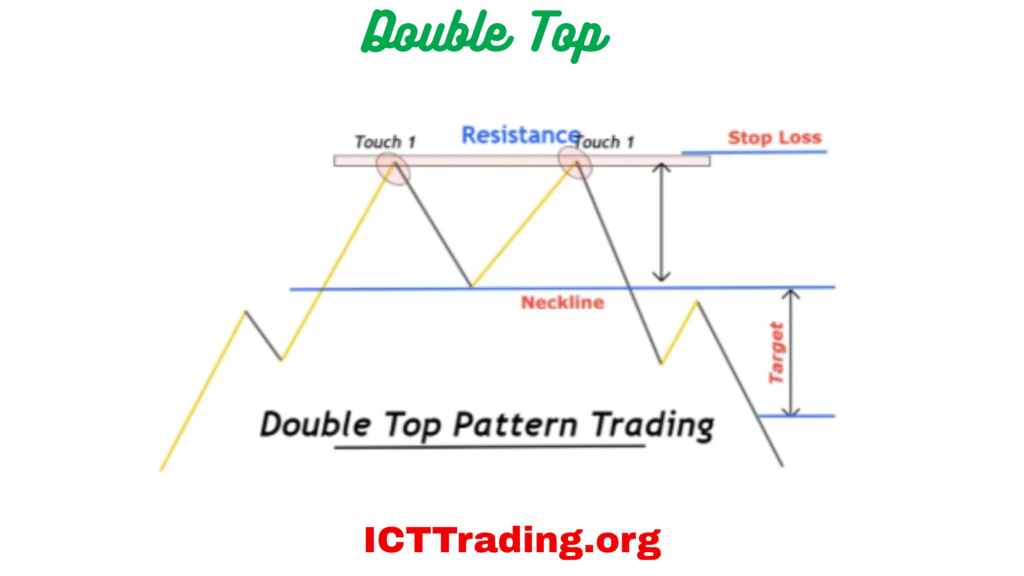
Double Top
- Definition: This is the opposite of the Double Bottom, forming two highs.
- Psychology: Indicates a strong resistance level, potentially reversing from bullish to bearish.
- Trading Strategy: Enter on a move below the support level between the tops. Set stop-loss above the higher of the two tops. The profit target is the distance between the tops and the support level, subtracted from the breakdown point.
Rising Wedge
- Definition: A bearish pattern with converging trendlines sloping upwards.
- Psychology: Indicates weakening upward momentum, potentially leading to a bearish reversal.
- Trading Strategy: Trade on a breakdown below the lower trendline. Placea stop-loss above the most recent swing high within the wedge. The profit target is calculated by subtracting the height of the wedge at its widest point from the breakdown level.
Understanding chart patterns is a fundamental step towards becoming a successful trader or investor. By incorporating these visual cues into your analysis, you can make more informed decisions, mitigate risks, and enhance your overall trading strategy.

Leave a Comment