

ICT Charter Price Action Model 1 Notes PDF
In this blog post, I will delve into the ICT Charter Price Action Model and share the valuable insights I’ve gained from it. My primary objective here is to contribute to the Inner Circle Trader Community by assisting fellow members in their learning journey. The information and knowledge I will be presenting are derived from this video resource.
Key Component of the ICT Charter Price Action Model
The foundation of this model lies on the concept of liqudity. Liquidity is present in term of Buy Stops and Sell Stops.
Learn more about what liquidity is
Where is Liquidity rest, and what algorithm is programmed to seek liquidity here It comes the new concept of IPDA Ranges
IPDA (Inter Price Bank Delivery Algorithm) Ranges
IPDA stand for Inter Price Bank Delivery Algorithm and its main goal is to hunt liqiidty. For making any trading Bias we first see 20 days back and marked on the chart key swing high and swing low point as you see in below image.

Make your trading narrative on this basis. The image above shows that IPDA seeks Buy side Liquidity of 20 previous days and their ultimate target is (sell side Liquidity of ) lows of the previous days.

ICT Price Action Model 1
Finding the Intra day scalping opportunity in between IPDA 20 day range or Some time ICT Refer its previous day high and low.
Trader Profile (Assumption)
- Not Willing to hold trade longer or overnight ( No swing Trading)
- Prefer quick setup over waiting for long-term setup formation
Entry Technique
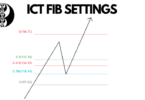
To enter into the trade, use the ICT Optimal Trade Entery of Fib Levels.

Buy Model
Buying only when the Daily has taken out a Swing High in the last 20 Days IPDA Data Range, and the price is not in the premium zones.
Buying can be considered at the Equilibrium of the daily range of the previous 20 days of IPDA


The ideal days for buying are Monday, Tuesday, and Wednesday in the New York Session.
Trade Between 7:00 am to 1:00 am on the new york kill zones ( time where market is hyper active ) IPDA seek liquidity.
Use the bullish Optimal Trade Entry Pattern at key levels 62%, 78%, plus 5 pips for spread entry


Sell Model

Take Short Position Only when the daily has taken out a swing low in the last 20 Days IPDA Data ranges and not in the Discount Zones. Learn more ICT Premium and Discount Zones.


To take short positions Monday to Wednesday, consider the ideal days
Trade between 7:00 am to 11:00 am in the New York session or kill zones
Use the OTE 62% level to enter into the trade
Important Points


Leave a Comment