
In this blog post, we’ll explore the concept of ICT Rejection Blocks. This is a powerful price pattern used in trading to predict future price movements. We will cover both bearish and bullish rejection blocks, helping you understand how to identify and use them in trading.
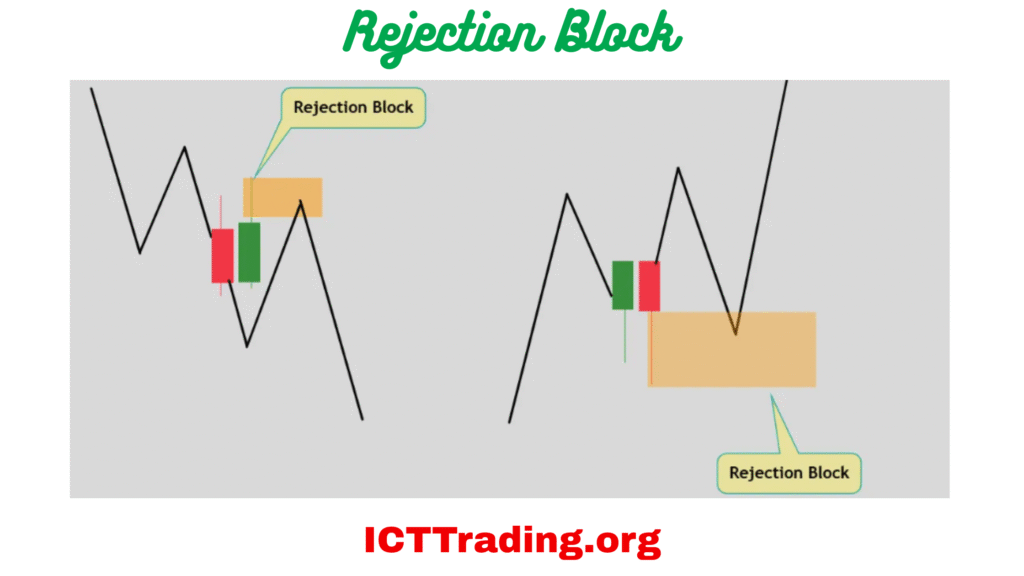
ICT Rejection Block
Bearish Rejection Block
ICT Bearish Rejection Block is a price pattern signalling potential downward movement.
A Bearish Rejection Block is formed when a price high has formed with long wicks on the highs of the candlestick and the price reaches up above the body of the candle to run Buy Side Liquidity out before the price declines.
Example of Bearish-Rejection Block
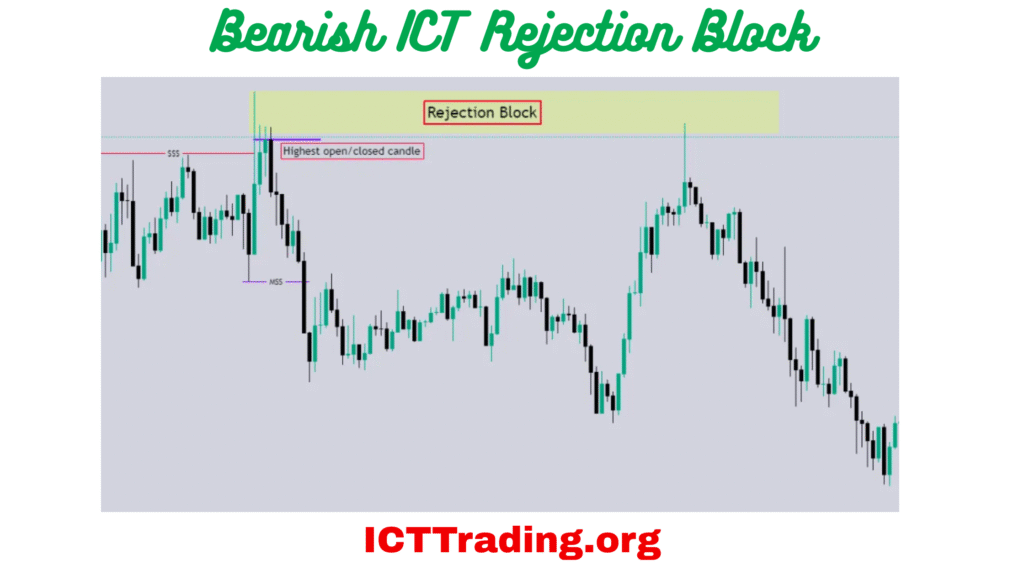
Bearish ICT Rejection Block
The above chart shows the rejection block on the EURUSD pair. The price goes down after the rejection from the Rejection block and triggers the Buy Stop Liquidity
Bullish Rejection Block
ICT Bullish Rejection Block indicates potential upward price movement.
A bullish Rejection Block is formed when a price low has formed with a long wick
On the low candlestick, the price reaches down the body of the candle to run sell-side liquidity out before the price Rallies higher.
Bullish Rejection Block Example
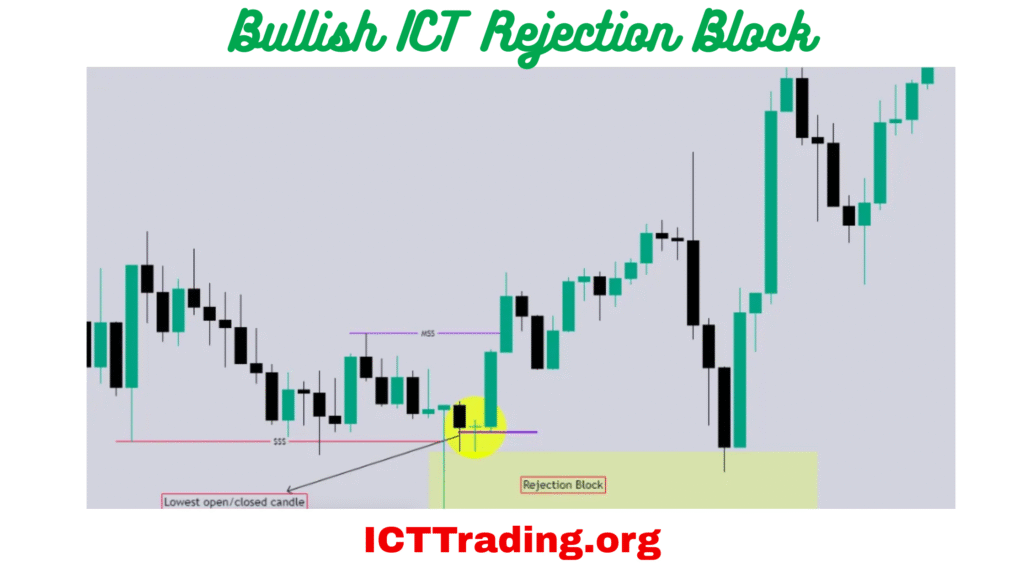
Bullish Rejection Block
ICT Rejection Block VS Order Block
| Aspect | Rejection Block (RB) | Order Block (OB) |
|---|---|---|
| Formation | Created by a strong reversal candle (e.g., pin bar, engulfing). | Forms from a breakaway candle’s body before a strong move. |
| Purpose | Signals potential reversals (price rejection). | Mark’s continuation zones (institutional orders). |
| Entry Trigger | Price retests the rejection candle and reverses. | Price retests the OB zone and continues the trend. |
| Market Context | Common in ranges/liquidity pools. | Found in trending markets (pullbacks). |
| Trading Bias | Counter-trend (fade the rejection). | Trend-following (join the breakout). |
(Key difference: RB = reversal, OB = continuation.)![]()


Leave a Comment