
In trading, divergence plays a crucial role in identifying potential market reversals and continuations. One such powerful concept is the ICT SMT Divergence, introduced by Inner Circle Trader (ICT) as part of the Smart Money Technique (SMT).
This article will explore SMT Divergence, its types, how to trade it effectively, the best time frames, and currency pairs to use. Whether you’re a beginner or an experienced trader, mastering ICT SMT Divergence can enhance your trading strategy
What is ICT SMT Divergence?
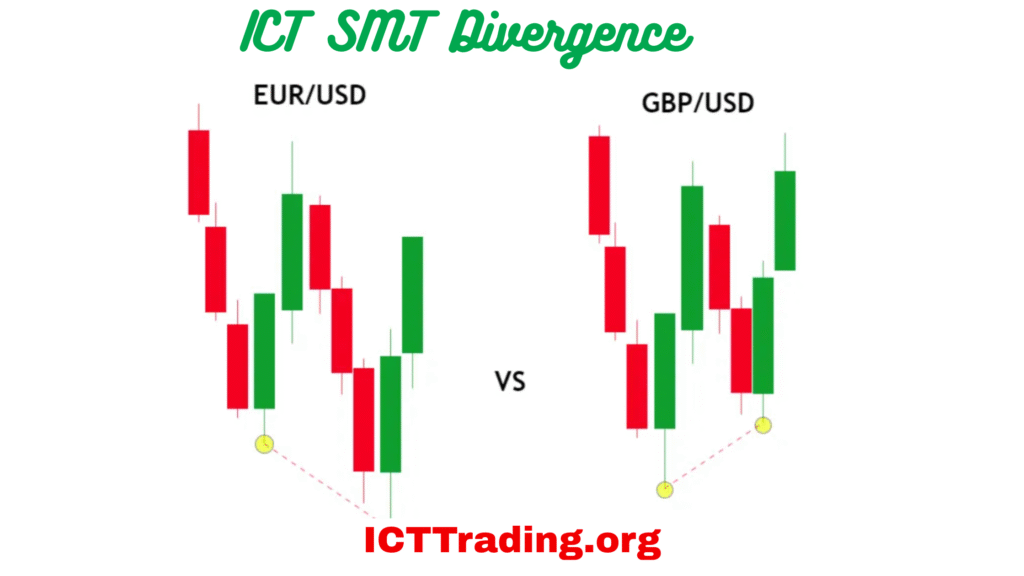
SMT Divergence
ICT SMT Divergence occurs when the price action and an oscillator (like RSI or MACD) move in opposite directions, signaling a potential reversal or continuation. Unlike traditional divergence, ICT’s approach focuses on market structure shifts and institutional trading behaviors.
Key Characteristics of SMT Divergence:
- Helps identify hidden institutional activity.
- Works best when combined with ICT concepts like Order Blocks and Liquidity Pools.
- Can signal trend reversals or continuations depending on the type.
Positive and Negative Correlation in ICT SMT
ICT SMT Divergence relies on understanding price-oscillator correlations:
1. Positive Correlation (No Divergence)
- Price makes higher highs (HH), and the oscillator also makes higher highs (HH).
- Price makes lower lows (LL), and the oscillator also makes lower lows (LL).
- Indicates trend continuation.
2. Negative Correlation (Divergence Present)
- Regular Bearish Divergence: Price makes higher highs (HH), but the oscillator makes lower highs (LH), signaling a potential reversal down.
- Regular Bullish Divergence: Price makes lower lows (LL), but the oscillator makes higher lows (HL), signaling a potential reversal up.
- Hidden Bearish Divergence: Price makes lower highs (LH), but the oscillator makes higher highs (HH), suggesting trend continuation downward.
- Hidden Bullish Divergence: Price makes higher lows (HL), but the oscillator makes lower lows (LL), suggesting trend continuation upward.
Types of ICT SMT Divergence
There are two primary types of ICT SMT Divergence:
- Bullish SMT Divergence (Signals Potential Upward Reversal)
- Bearish SMT Divergence (Signals Potential Downward Reversal)
Let’s break down each type in detail.
(I) Bullish SMT Divergence
Bullish divergence occurs when price makes lower lows (LL), but the oscillator forms higher lows (HL), indicating weakening selling pressure and a potential upward reversal.
How to Identify Bullish SMT Divergence?
- Price Action: Forms Lower Lows (LL) in a downtrend.
- Oscillator (RSI/MACD): Forms Higher Lows (HL) instead of following the price.
- Market Structure: Often appears near liquidity pools, order blocks, or demand zones.
Trading Implications
- Reversal Signal: Suggests buyers are stepping in, and a trend reversal may occur.
- Entry Trigger: Look for a break of structure (BOS) failure or a shift in market structure.
- Confirmation: Combine with ICT concepts like FVG (Fair Value Gap) or bullish order blocks.
Example:
- Price makes Lower Low (LL) at $1.2000 → RSI makes Higher Low (HL).
- Entry when price breaks above the recent swing high with volume confirmation.
(II) Bearish SMT Divergence
Bearish divergence happens when price makes higher highs (HH), but the oscillator forms lower highs (LH), indicating weakening buying pressure and a potential downward reversal.
How to Identify Bearish SMT Divergence?
- Price Action: Forms Higher Highs (HH) in an uptrend.
- Oscillator (RSI/MACD): Forms Lower Highs (LH) instead of following price.
- Market Structure: Often appears near supply zones, order blocks, or liquidity sweeps.
Trading Implications
- Reversal Signal: Indicates sellers are gaining control, and a downtrend may begin.
- Entry Trigger: Watch for a break of structure (BOS) failure or shift in market structure.
- Confirmation: Use ICT concepts like bearish order blocks or liquidity voids.
Example:
- Price makes a Higher High (HH) at $1.2500 → RSI makes Lower High (LH).
- Entry when price breaks below the recent swing low with increasing momentum.
How to Trade ICT SMT Divergence?
Here’s a step-by-step approach to trading SMT Divergence effectively:
Step 1: Identify Market Structure
Determine if the trend is bullish or bearish using Higher Highs (HH) & Lower Lows (LL).
Step 2: Apply an Oscillator (RSI/MACD)
Look for divergence signals between price and the oscillator.
Step 3: Confirm with ICT Concepts
Check for Order Blocks, Liquidity Pools, or Fair Value Gaps (FVG) for additional confirmation.
Step 4: Enter the Trade
- For Regular Divergence: Enter at the break of structure (BOS) failure.
- For Hidden Divergence: Enter in the direction of the trend.
Step 5: Manage Risk
- Place stops beyond recent swing highs/lows.
- Use a 1:2 or 1:3 Risk-Reward Ratio.
Best Time Frame to Spot ICT SMT Divergence
While divergence can be seen on any time frame, the most reliable ones are:
- 1H & 4H (Swing Trading): Best balance between noise and accuracy.
- 15M & 30M (Intraday Trading): Useful for scalpers but requires more filtering.
- Daily (Position Trading): Strong signals but fewer opportunities.
Tip: Always align divergence with higher time frame trends for better accuracy.
Best Pairs for ICT SMT Divergence
Some currency pairs respond well to divergence strategies due to their liquidity and volatility:
| Currency Pair | Why It Works? |
|---|---|
| EUR/USD | High liquidity, clear trends. |
| GBP/USD | Strong momentum, good divergence setups. |
| USD/JPY | Responsive to RSI/MACD divergences. |
| AUD/USD | Good for hidden divergence plays. |
| Gold (XAU/USD) | Strong trend-following characteristics. |
FAQ About SMT Divergence
1. What is SMT Divergence in trading?
SMT Divergence is a concept from ICT that identifies discrepancies between price and an oscillator to predict reversals or continuations.
2. How is ICT SMT different from regular divergence?
ICT SMT incorporates market structure, liquidity, and institutional order flow, making it more refined than traditional divergence.
3. Can I use SMT Divergence for scalping?
Yes, but it’s best used on 15M or 30M charts with additional confirmation from liquidity zones.
4. Where can I find an SMT Divergence PDF guide?
ICT’s mentorship content covers SMT Divergence in detail. Some traders compile free PDFs, but always refer to official ICT materials for accuracy.
5. Which indicator is best for spotting SMT Divergence?
- RSI (14-period): Best for clear divergence signals.
- MACD (12,26,9): Helps confirm momentum shifts.
Conclusion
ICT SMT Divergence is a powerful tool when combined with other Smart Money Concepts. By understanding regular vs. hidden divergence, aligning it with market structure, and using the right time frames, traders can improve their accuracy significantly


Leave a Comment