
Supply and Demand trading is a powerful approach used by traders to identify high-probability reversal zones in the market. A particularly powerful pattern in this framework is the Rally Base Drop (RBD). This pattern helps traders spot potential selling opportunities when the price revisits a supply zone.
In this article, we’ll break down:
- What is Rally Base Drop in Supply and Demand?
- How to Identify Rally Base Drop?
- How to Draw Supply Zone in RBD Pattern?
- Psychology Behind RBD Pattern
- How to Trade RBD Pattern?
- Key Characteristics of Rally Base Drop
- Considerations & Limitations
- Conclusion
What is Rally Base Drop?
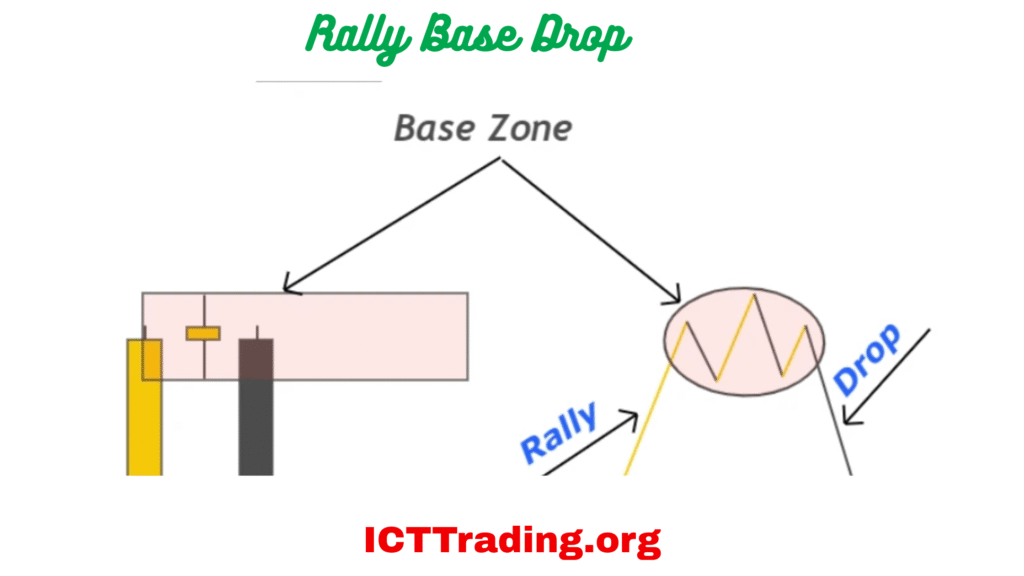
Rally Base Drop
The Rally Base Drop (RBD) is a bearish reversal pattern that occurs when:
- Rally: Price makes a strong upward move (rally).
- Base: The rally slows down, and price consolidates (base formation).
- Drop: Price breaks down from the base, creating a new lower low.
When price returns to this base (now acting as a supply zone), traders look for selling opportunities, expecting another drop.
Learn: Drop base Rally
Example:
Imagine a stock rallies from $100 to $150, consolidates between $145-$150, then drops sharply to $120. If price later returns to the $145-$150 zone, sellers may step in again, causing another decline.
How to Identify Rally Base Drop?
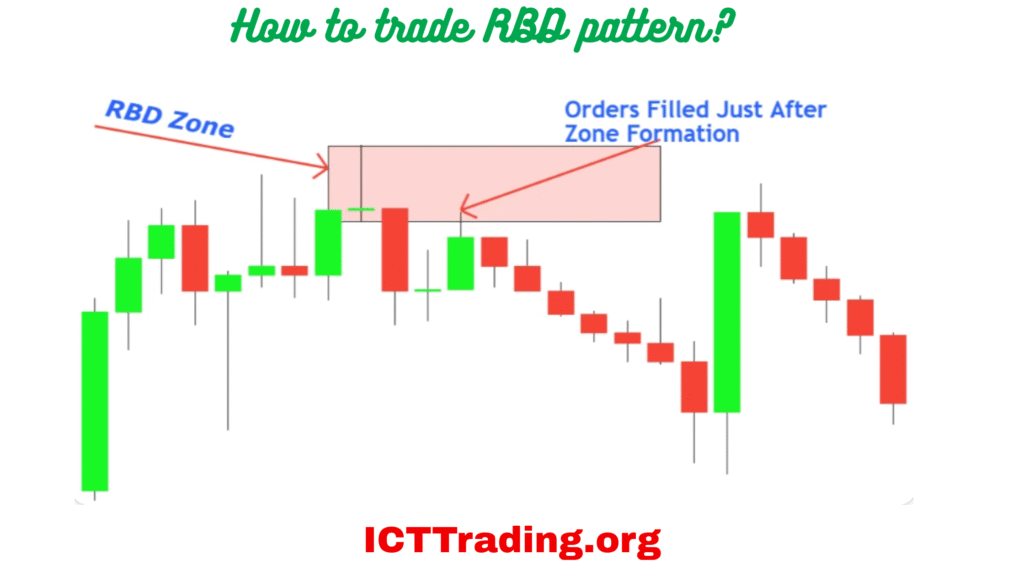
How to trade RBD pattern?
To spot an RBD pattern, follow these steps:
- Look for a Strong Rally: A sharp upward move with little to no pullbacks.
- Find the Base (Consolidation): The price slows down after the rally and moves sideways.
- Watch for the Drop: A strong bearish breakout from the base.
- Mark the Supply Zone: The consolidation area becomes a supply zone for future trades.
Key Tip:
The drop should be fast and impulsive, indicating strong selling pressure. If the drop is slow, the pattern may be weaker.
How to Draw a Supply Zone in an RBD Pattern?
The supply zone in RBD is the consolidation area before the drop. Here’s how to draw it:
- Identify the Base: Locate the sideways movement after the rally.
- Mark the High & Low of the Base: The top of the base is the upper supply limit, and the bottom is the lower supply limit.
- Extend the Zone: Draw a rectangle covering the entire consolidation area.
Example:
- Rally: $100 → $150
- Base: $145-$150 (5-point range)
- Drop: $150 → $120
- Supply Zone: $145-$150 (highlighted for future trades)
Learn: Rally Base Rally
Psychology Behind RBD Pattern
Understanding market psychology is key to trading RBD:
- During the Rally: Buyers are in control, pushing prices up aggressively.
- During the Base: Smart money starts distributing (selling) their positions, leading to consolidation.
- During the Drop: Sellers overwhelm buyers, causing a sharp decline.
- On Retest: Traders who missed the first drop now sell, reinforcing the supply zone.
This creates a self-fulfilling cycle where price reacts strongly at the same zone.
How to Trade RBD Pattern?
Here’s a step-by-step trading strategy:
1. Find a Valid RBD Pattern
Look for a strong rally, base, and impulsive drop.
2. Mark the Supply Zone
Highlight the consolidation area before the drop.
3. Wait for Price to Return
When price revisits the supply zone, watch for rejection signals:
- Bearish engulfing candles
- Pin bars
- Strong wicks
4. Enter Short
Place a sell order near the upper supply limit with a stop-loss above the zone.
5. Take Profit Levels
- First Target: Previous low (initial drop level).
- Second Target: Extended Fibonacci levels or support zones.
Example Trade Setup:
- Supply Zone: $145-$150
- Entry: $147 (on rejection)
- Stop Loss: $151 (above the zone)
- Take Profit: $120 (previous low)
Key Characteristics of Rally Base Drop
- Strong Initial Rally: The move up should be fast and steep.
- Clear Base Formation: A well-defined consolidation before the drop.
- Sharp Drop: The breakdown should be quick, showing seller dominance.
- Clean Retest: When the price returns, it should react strongly at the zone.
Considerations & Limitations
- False Breakouts: Sometimes price breaks above the supply zone before reversing. Use stop-losses.
- Weak Drop: If the initial drop is slow, the pattern may fail.
- Market Context Matters: RBD works best in trending or ranging markets, not choppy conditions.
- Volume Confirmation: Higher volume on the drop increases reliability.
Conclusion
The Rally Base Drop (RBD) is a high-probability supply and demand pattern used to pinpoint optimal short-selling opportunities. By understanding its structure, psychology, and execution, traders can improve their success rate.
Key Takeaways:
- RBD = Rally + Base + Drop
- Supply zone = Base area before the drop
- Trade on retest with bearish confirmation
- Always use stop-loss and manage risk


Leave a Comment