

Welcome to the world of Trading , where every candlestick pattern tells a story, and understanding these patterns can be like unlocking a secret language of wealth and opportunity.
This pattern isn’t just a series of lines on a chart; it’s a narrative of market enthusiasm, a drama of bulls and bears, and a beacon that guides traders through the tumultuous seas of trading.
Definition of the Upside Tasuki Gap Candlestick Pattern
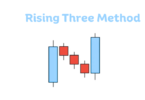
The Upside Tasuki Gap is formed by a sequence of three specific candlesticks:
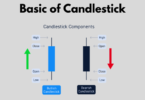
- First Candlestick: A large bullish (green) candlestick that continues the prevailing uptrend.
- Second Candlestick: Another bullish candlestick that opens with a gap above the first candlestick, reinforcing the ongoing uptrend.
- Third Candlestick: A bearish (red) candlestick that opens within the body of the second candlestick and closes within the gap between the first and second candlesticks, but does not completely fill the gap.
This pattern is unique because of the gap it involves, which is not filled by the third candlestick, signifying a specific market psychology.
Psychology of the Upside Tasuki Gap Pattern
The psychology behind the Upside Tasuki Gap pattern is rooted in market momentum and trader sentiment. The initial bullish candles reflect strong buying interest and a clear uptrend. The gap indicates continued enthusiasm, as prices open higher than the previous day’s close. However, the introduction of a bearish third candlestick suggests that some traders are taking profits, causing a slight dip in prices.
Yet, the key point is that this bearish candlestick does not fill the gap. This indicates that, despite some selling pressure, the overall bullish sentiment remains strong. Traders interpret this as a sign that the uptrend is likely to continue, as the selling pressure is not sufficient to reverse the trend.
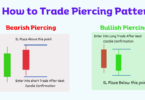
How to Trade the Upside Tasuki Gap Pattern
Trading the Upside Tasuki Gap requires careful observation and strategic planning:
- Pattern Identification: First and foremost, accurately identify the pattern in the context of an existing uptrend. Look for two consecutive bullish candlesticks followed by a bearish candlestick that partially fills the gap.
- Entry Point: A common strategy is to enter a trade after the pattern is completed, specifically after the close of the third candlestick. This entry is predicated on the expectation that the uptrend will continue.
- Stop-Loss Orders: Set a stop-loss order below the lowest point of the third candlestick or the gap. This helps manage risk if the trend unexpectedly reverses.
- Profit Targets: Set profit targets based on previous resistance levels or by using a risk-reward ratio that suits your trading style. For instance, if your stop loss is set at a distance of $2 from your entry point, set a profit target at a point that is at least $4 away.
- Monitor Market Context: Always consider overall market conditions and news that could affect stock performance. No pattern works in isolation, and external factors can significantly impact price movements.
- Exit Strategy: Be ready with an exit strategy. If the stock continues to rise, you may choose to stay in the trade but be prepared to exit if there are signs of a trend reversal or if the stock hits your profit targets.
The Upside Tasuki Gap is a valuable pattern in technical analysis, providing insights into market sentiment and potential continuation of trends. As with any trading strategy, it is crucial to consider this pattern as part of a broader analysis, incorporating other technical indicators and market news.
Leave a Comment